When your check engine light comes on, a fault code points you toward a system, but it rarely tells you which part has failed. The real story is in live sensor data. Reading OBD2 sensor test results lets you watch what the computer sees in real time, so you can confirm a bad oxygen sensor, a dirty mass airflow sensor, or a lazy coolant temperature sensor before you start replacing parts.
Why Live Sensor Data Beats Fault Codes Alone
A code like P0133 (slow oxygen sensor response) is a symptom, not a diagnosis. The upstream oxygen sensor might be old, or it might be reacting slowly because of a vacuum leak or a rich-running engine. Live data shows you the actual voltage swings, fuel trim numbers, and sensor response times. That context prevents you from throwing parts at a problem.
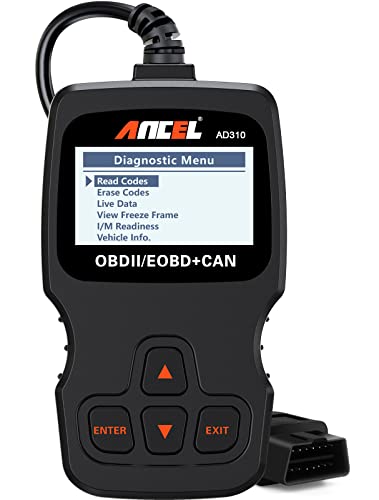
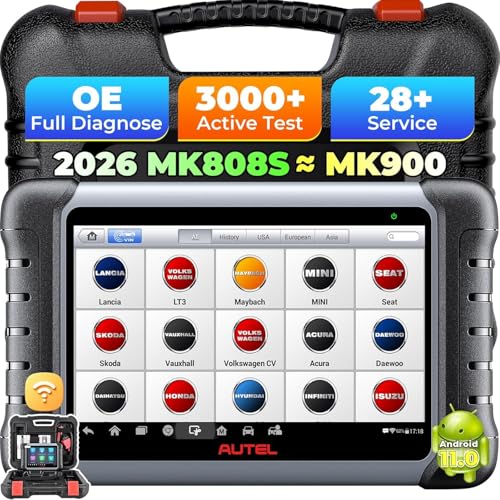
You do not need a professional scan tool to see most of this. Many affordable OBD2 apps and handheld scanners display live data, freeze frame, and sensor test results. The key is knowing which numbers matter and what normal looks like.
How to Access Sensor Test Results on Your Scanner
Plug your scanner into the OBD2 port under the dash, turn the ignition to run (engine off or idling, depending on the test), and connect. Navigate to live data or sensor tests. Menus vary, but you are looking for PIDs (parameter IDs) such as O2 sensor voltage, short term fuel trim, long term fuel trim, mass airflow rate, and coolant temperature.
Start with a warm engine at idle. Note the values, then rev the engine gently and watch how they change. A sensor that responds quickly and smoothly is usually healthy. One that lags, sticks, or swings wildly deserves a closer look.
Oxygen Sensor Test Results: What Normal Looks Like
On a warmed-up engine, a good upstream oxygen sensor switches rapidly between about 0.1 and 0.9 volts, often several times per second. Downstream sensors (after the catalytic converter) should hold a fairly steady voltage, usually between 0.5 and 0.8 volts.
- Upstream sensor stuck at 0.45 volts: likely a dead or unheated sensor.
- Upstream sensor slow to switch: could be a lazy sensor, exhaust leak, or fuel delivery issue.
- Downstream sensor switching like the upstream one: the catalytic converter may be failing.
- Voltage fixed high (0.8 to 0.9 volts) or low (0.1 to 0.2 volts): check for wiring shorts, vacuum leaks, or fuel pressure problems.
If the scanner shows oxygen sensor heater circuit tests, look for a pass or fail result. A failed heater test often means the sensor needs replacement, but confirm the fuse and wiring first.
Mass Airflow (MAF) and Fuel Trim Checks
Mass airflow sensor data is shown in grams per second (g/s). At idle, a typical four-cylinder engine might read 2 to 5 g/s, while a V6 or V8 reads higher. During a gentle rev, the number should rise smoothly. If it barely moves or jumps erratically, the MAF may be dirty or failing.
Fuel trim is the computer’s correction for rich or lean conditions. Short term fuel trim (STFT) and long term fuel trim (LTFT) are shown as percentages. Ideally, both stay within plus or minus 10 percent. Large positive numbers (over 15 percent) mean the engine is running lean and the computer is adding fuel. Large negative numbers mean it is running rich.
- High positive trims at idle: suspect a vacuum leak.
- High positive trims at cruise: suspect a weak fuel pump, clogged filter, or dirty MAF.
- High negative trims: suspect leaking injectors, high fuel pressure, or a faulty MAF reading.
Coolant Temperature and Intake Air Sensor Results
Coolant temperature should climb steadily from ambient to about 195 to 220 degrees Fahrenheit once the engine warms up. If it stays low, the thermostat may be stuck open. If it spikes quickly or reads a fixed unrealistic value, the sensor or wiring is suspect.
Intake air temperature should roughly match under-hood temperature after a cold start and rise slightly as the engine bay heats up. A reading that is way off, like 40 degrees below ambient on a warm day, points to a bad sensor or a wiring issue.
Putting Sensor Tests Together for a Diagnosis
No single number tells the whole story. A lean code with high positive fuel trims, a normal MAF reading, and a steady oxygen sensor points toward a vacuum leak. The same code with a low MAF reading and slow oxygen switching suggests a dirty or failing MAF sensor. By cross-checking oxygen sensor voltage, fuel trim, MAF, and temperature data, you can narrow down the fault before you buy a single part.
Take a screenshot or write down your readings before and after any repair. That baseline makes it easy to confirm the fix and catch related issues early. With a little practice, reading OBD2 sensor test results becomes a fast, reliable way to solve check engine lights without guesswork.
Frequently Asked Questions
Can I read OBD2 sensor test results with a cheap scanner?
Yes. Many basic OBD2 scanners and smartphone apps display live data like oxygen sensor voltage, fuel trim, and coolant temperature. You do not need a professional tool to see the most useful sensor PIDs, though advanced tests may require a higher-end scanner.
What should oxygen sensor voltage be at idle?
On a warmed-up engine, an upstream oxygen sensor should switch rapidly between about 0.1 and 0.9 volts. A downstream sensor should hold a steady 0.5 to 0.8 volts. If the upstream sensor stays fixed near 0.45 volts, it is likely failing.
How do I know if my fuel trim numbers are bad?
Short and long term fuel trim should stay within plus or minus 10 percent. Readings consistently above plus 15 percent indicate a lean condition, while readings below minus 15 percent indicate a rich condition. Both point to underlying issues worth investigating.